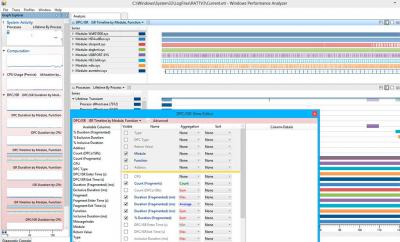
Estoy teniendo problemas de rendimiento y no se por donde arreglarlo, ya he pasado antivirus, antispywares, limpiado el registro, defragmentado, actualizado,desinstalado funciones extra, deshabilitado practicamente todas las aplicaciones de inicio y servicios que no son esenciales.
pero aun asi el sistema no fluye desde hace un par de semanas.
pero aun asi el sistema no fluye desde hace un par de semanas.
Alguien escribió:_________________________________________________________________________________________________________
CONCLUSION
_________________________________________________________________________________________________________
Your system appears to be having trouble handling real-time audio and other tasks. You are likely to experience buffer underruns appearing as drop outs, clicks or pops. One problem may be related to power management, disable CPU throttling settings in Control Panel and BIOS setup. Check for BIOS updates.
LatencyMon has been analyzing your system for 0:02:34 (h:mm:ss) on all processors.
_________________________________________________________________________________________________________
SYSTEM INFORMATION
_________________________________________________________________________________________________________
Computer name: SYSTEM
OS version: Windows 7 Service Pack 1, 6.1, build: 7601 (x64)
Hardware: ASUSTeK Computer INC., P5N-MX
CPU: GenuineIntel Intel(R) Pentium(R) Dual CPU E2180 @ 2.00GHz
Logical processors: 2
Processor groups: 1
RAM: 3837 MB total
_________________________________________________________________________________________________________
CPU SPEED
_________________________________________________________________________________________________________
Reported CPU speed: 2000,0 MHz
Measured CPU speed: 2027,0 MHz (approx.)
Note: reported execution times may be calculated based on a fixed reported CPU speed. Disable variable speed settings like Intel Speed Step and AMD Cool N Quiet in the BIOS setup for more accurate results.
_________________________________________________________________________________________________________
MEASURED INTERRUPT TO USER PROCESS LATENCIES
_________________________________________________________________________________________________________
The interrupt to process latency reflects the measured interval that a usermode process needed to respond to a hardware request from the moment the interrupt service routine started execution. This includes the scheduling and execution of a DPC routine, the signaling of an event and the waking up of a usermode thread from an idle wait state in response to that event.
Highest measured interrupt to process latency (µs): 37566,225878
Average measured interrupt to process latency (µs): 9,249586
Highest measured interrupt to DPC latency (µs): 437,239269
Average measured interrupt to DPC latency (µs): 3,154517
_________________________________________________________________________________________________________
MEASURED SMI, IPI AND CPU STALLS
_________________________________________________________________________________________________________
The SMI, IPI and CPU stalls value represents the highest measured interval that a CPU did not respond while having its maskable interrupts disabled.
Highest measured SMI or CPU stall (µs) 1,535969
_________________________________________________________________________________________________________
REPORTED ISRs
_________________________________________________________________________________________________________
Interrupt service routines are routines installed by the OS and device drivers that execute in response to a hardware interrupt signal.
Highest ISR routine execution time (µs): 273,220
Driver with highest ISR routine execution time: dxgkrnl.sys - DirectX Graphics Kernel, Microsoft Corporation
Highest reported total ISR routine time (%): 0,382714
Driver with highest ISR total time: hal.dll - Hardware Abstraction Layer DLL, Microsoft Corporation
Total time spent in ISRs (%) 0,962326
ISR count (execution time <250 µs): 532916
ISR count (execution time 250-500 µs): 0
ISR count (execution time 500-999 µs): 1
ISR count (execution time 1000-1999 µs): 0
ISR count (execution time 2000-3999 µs): 0
ISR count (execution time >=4000 µs): 0
_________________________________________________________________________________________________________
REPORTED DPCs
_________________________________________________________________________________________________________
DPC routines are part of the interrupt servicing dispatch mechanism and disable the possibility for a process to utilize the CPU while it is interrupted until the DPC has finished execution.
Highest DPC routine execution time (µs): 714,0450
Driver with highest DPC routine execution time: ndis.sys - Controlador NDIS 6.20, Microsoft Corporation
Highest reported total DPC routine time (%): 3,322876
Driver with highest DPC total execution time: Wdf01000.sys - Motor en tiempo de ejecución del marco de controlador en modo kernel, Microsoft Corporation
Total time spent in DPCs (%) 6,614918
DPC count (execution time <250 µs): 1085773
DPC count (execution time 250-500 µs): 0
DPC count (execution time 500-999 µs): 854
DPC count (execution time 1000-1999 µs): 0
DPC count (execution time 2000-3999 µs): 0
DPC count (execution time >=4000 µs): 0
_________________________________________________________________________________________________________
REPORTED HARD PAGEFAULTS
_________________________________________________________________________________________________________
Hard pagefaults are events that get triggered by making use of virtual memory that is not resident in RAM but backed by a memory mapped file on disk. The process of resolving the hard pagefault requires reading in the memory from disk while the process is interrupted and blocked from execution.
NOTE: some processes were hit by hard pagefaults. If these were programs producing audio, they are likely to interrupt the audio stream resulting in dropouts, clicks and pops. Check the Processes tab to see which programs were hit.
Process with highest pagefault count: firefox.exe
Total number of hard pagefaults 30
Hard pagefault count of hardest hit process: 22
Highest hard pagefault resolution time (µs): 199960,7620
Total time spent in hard pagefaults (%): 0,312624
Number of processes hit: 6
_________________________________________________________________________________________________________
PER CPU DATA
_________________________________________________________________________________________________________
CPU 0 Interrupt cycle time (s): 23,804245
CPU 0 ISR highest execution time (µs): 273,220
CPU 0 ISR total execution time (s): 2,967273
CPU 0 ISR count: 532917
CPU 0 DPC highest execution time (µs): 714,0450
CPU 0 DPC total execution time (s): 20,284905
CPU 0 DPC count: 1066532
_________________________________________________________________________________________________________
CPU 1 Interrupt cycle time (s): 0,712746
CPU 1 ISR highest execution time (µs): 0,0
CPU 1 ISR total execution time (s): 0,0
CPU 1 ISR count: 0
CPU 1 DPC highest execution time (µs): 380,0050
CPU 1 DPC total execution time (s): 0,111798
CPU 1 DPC count: 20095
_________________________________________________________________________________________________________


